
To demonstrate how to engage with the framework using the Designation Determination Tool, we will follow District A’s decision-making process throughout the framework.
Designation Determination Tool
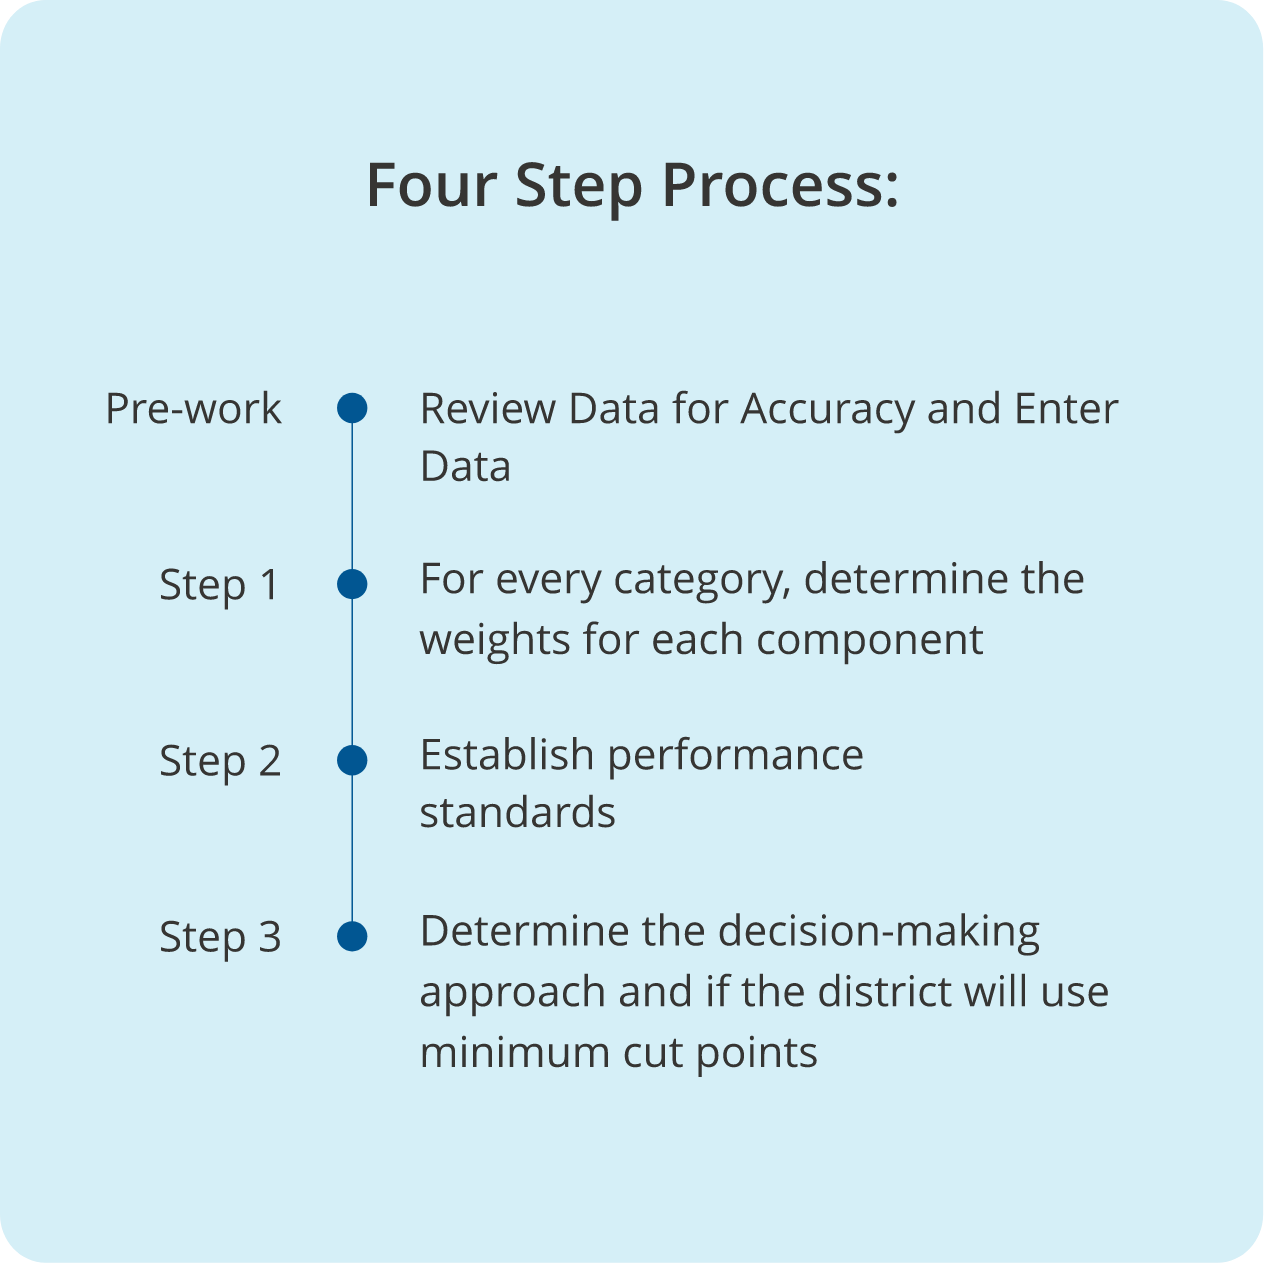
Review Data for Accuracy and Enter DataPre-work Review Data for Accuracy and Enter Data
Districts must ensure all data has been collected and checked for accuracy and completion. Using multiple teacher identifiers (like a local or unique ID and date of birth) in district data management systems reduces errors in tracking teacher identification, student linkages, as well as observation and student growth data. Once the file is accepted, TEA cannot modify district’s data submission. Many districts consult with a data analyst or technology systems manager for assistance with data compilation and analysis.
TIA Designation Determination Tool: “Data Entry” tab (“Multiple Student Growth Measure” and “Optional Component Data” tabs if applicable)
Once the data has been reviewed for accuracy, enter the data in the Data Entry tab (and “Multiple Student Growth Measure” and “Optional Component Data” tabs if applicable).
For every category, determine the weights for each componentStep 1 For every category, determine the weights for each component
TIA Designation Determination Tool: “Weights” tab
Districts can establish any weights for their components that total to 100% when combined. Weights are determined by districts’ priorities, alignment to strategic plans, among other determining factors. Here are a few examples:
- District Z is prioritizing accurate appraisal ratings and investing more time in their calibration protocols. They have decided to weigh teacher observation at 60% and student growth at 40%.
- District Y has heard overwhelmingly from their stakeholders that student growth is more demonstrative of a teachers’ performance as opposed to appraisal ratings. They have decided to weigh teacher observation at 40% and student growth at 60%.
- District X believes that some growth measures hold stronger weight than others, so there is a mix of weights in each category. Category 1 weighs teacher observation and student growth at 50% while Category 2 and 3 weight teacher observation at 45% and student growth at 55%.
Example: District A’s stakeholders believe strongly that both their teachers’ appraisal ratings and student growth scores evenly represent teacher performance. They have chosen to weigh teacher observation and student growth equally at 50% each for every category.
| Teacher Observation |
|---|
| 50% |
| Student Growth |
|---|
| 50% |
Step 2 Establish performance standards
TIA Designation Determination Tool: “Designation Decisions” tab
In this step, districts set the performance standards that determine what level of performance earns each designation level for each component (i.e. teacher observation, student growth, and the optional component if applicable).
Districts may use statewide performance standards or create their own local standards.
Example: District A (an average performing district) uses the statewide performance standards and does not implement an optional component.
| Acknowledged | Recognized | Exemplary | Master | |
|---|---|---|---|---|
| Teacher Observation | 3.5 | 3.7 | 3.9 | 4.5 |
| Student Growth | 50% | 55% | 60% | 70% |
TIA Designation Determination Tool: “Analysis” tab
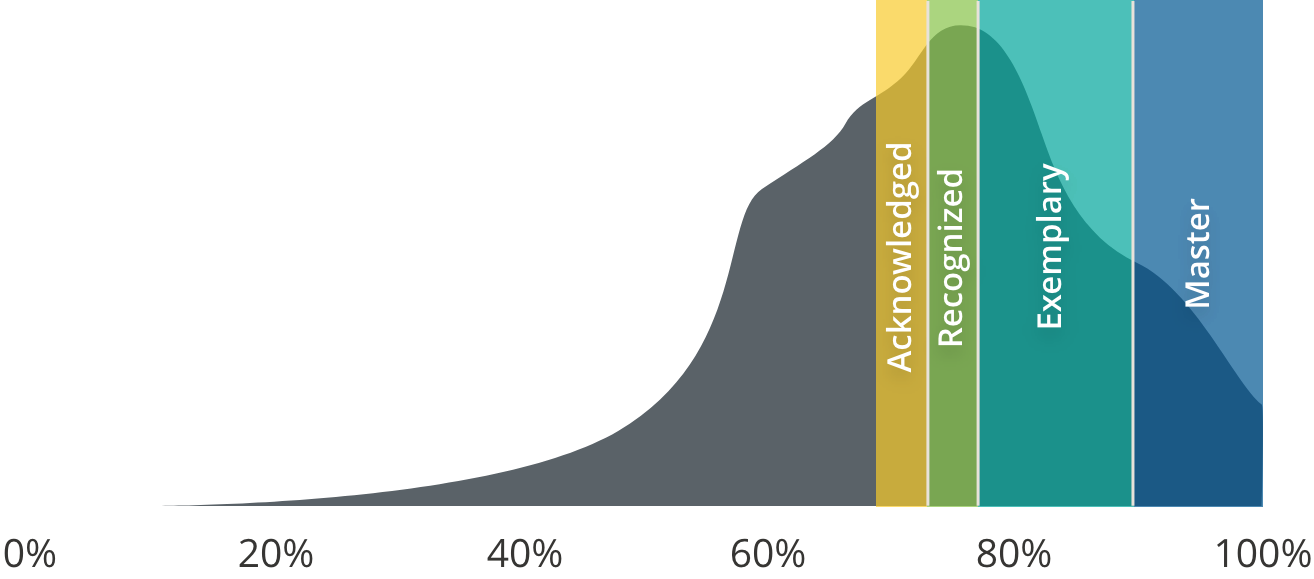
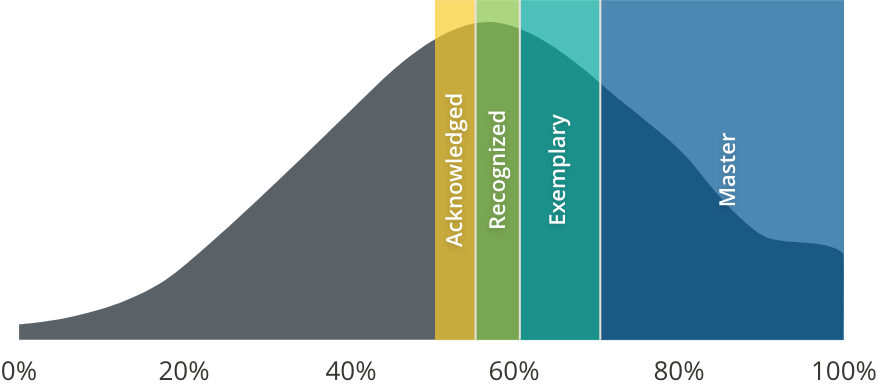
The “Analysis” tab will provide a table breaking down the designated teacher proportions by teacher observation performance standards and student growth performance standards. These are not final designations.
Note: The visuals below are meant to serve as an illustration for these breakdown proportions and are not available in the tool.
| Teacher Observation Performance |
|---|
 |
| Student Growth Performance |
|---|
 |
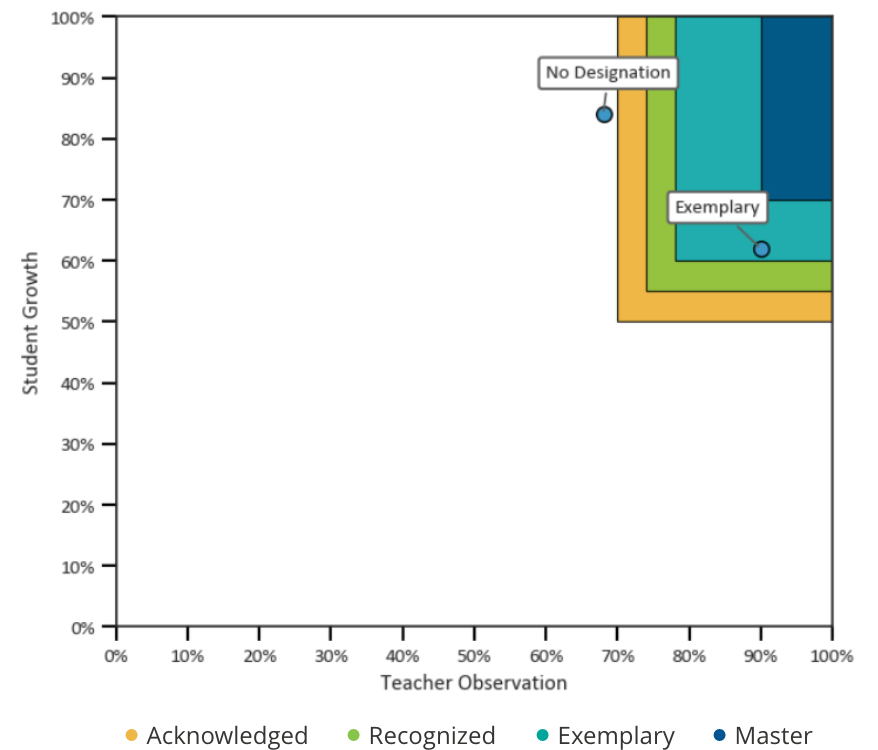
Step 3 Determine the decision-making approach and if the district will use minimum cut points
Districts often use one of the following three decision-making approaches.
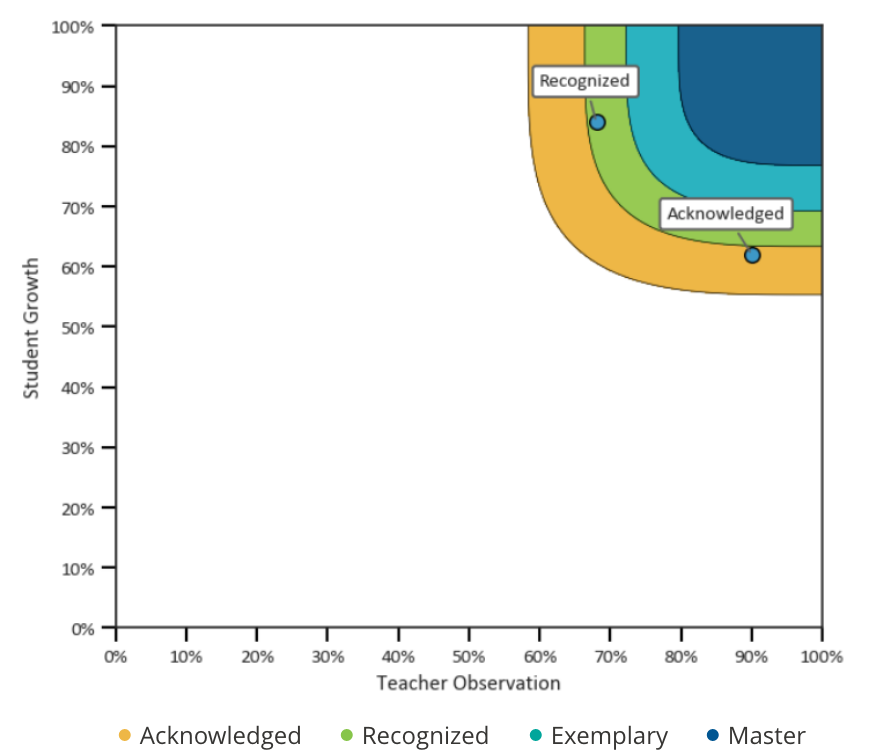
- A non-compensatory approach sets minimum cut points for specific measures, and any teacher who does not meet those minimums is not eligible for a designation.
- A compensatory approach values high performance, allowing strengths in one area to offset weaker performance in another.
- A hybrid approach combines both non-compensatory and compensatory methods. For example, teachers must first meet the minimum criteria to be considered. Then, a compensatory method is then used to weigh multiple data points and determine the final designation level.
| Non-Compensatory |
|---|
 Click to enlarge image Click to enlarge image |
| Benefits |
| Forces alignment with statewide performance standards. Simple to communicate |
| Costs |
| Teachers who perform high in one component but lack in another may be awarded no/lower designation |
| Tool Notes |
| Uses performance standards and cut points |
| Compensatory |
|---|
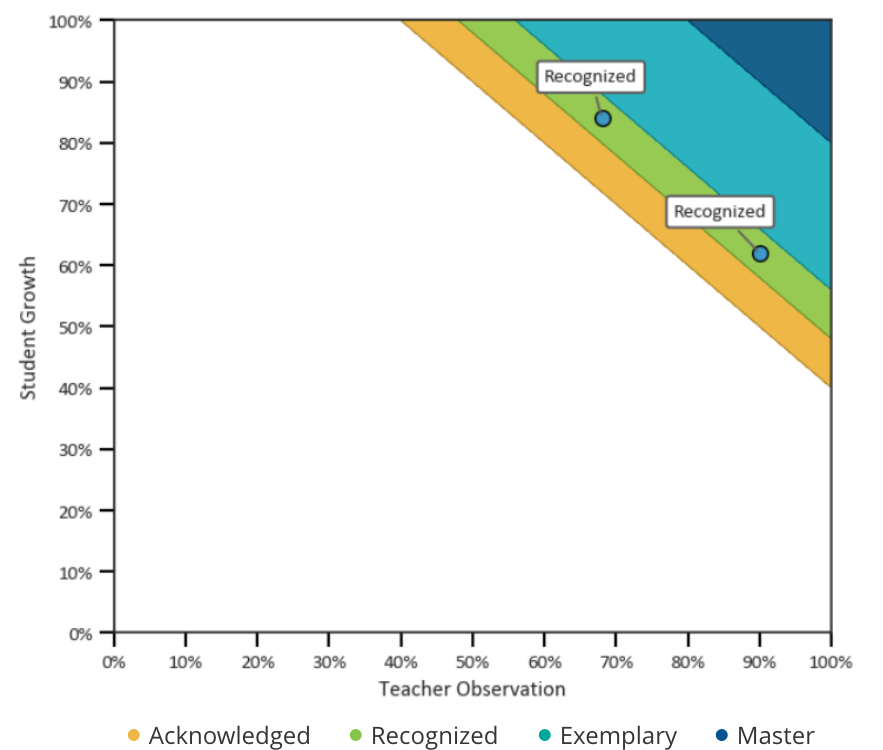 Click to enlarge image Click to enlarge image |
| Benefits |
| More inclusive of high teacher performance (don’t need to meet minimums in both components) |
| Costs |
| Possibly misalign with statewide performance standards on one component if data is inflated Possibly misalign teachers’ performance across campuses and across assignments Standards are less transparent |
| Tool Notes |
| Only uses performance standards |
| Hybrid |
|---|
 Click to enlarge image Click to enlarge image |
| Benefits |
| Has some safeguards to meet statewide performance standards More flexible for nuanced performance |
| Costs |
| Possibly misalign with statewide performance standards on one component if data is inflated Standards are less transparent |
| Tool Notes |
| Uses performance standards and cut points |
TIA Designation Determination Tool: “Designation Results” and “Analysis” tabs
Examine each approach using the Designation Determination tool, and determine how it would impact the proportions of designations. The “Designation Results” tab will display which teachers received a designation. The “Analysis” tab will provide a dashboard that will breakdown designation proportions by campuses and categories.
Example: District A’s decision-making approaches are illustrated below for the entire district’s submitted data.
Note: Districts will see a funnel chart in the tool. This type of holistic illustration is not currently available in the tool.
| Non-Compensatory |
|---|
| Minimums ✓ |
| No performance flexibility |
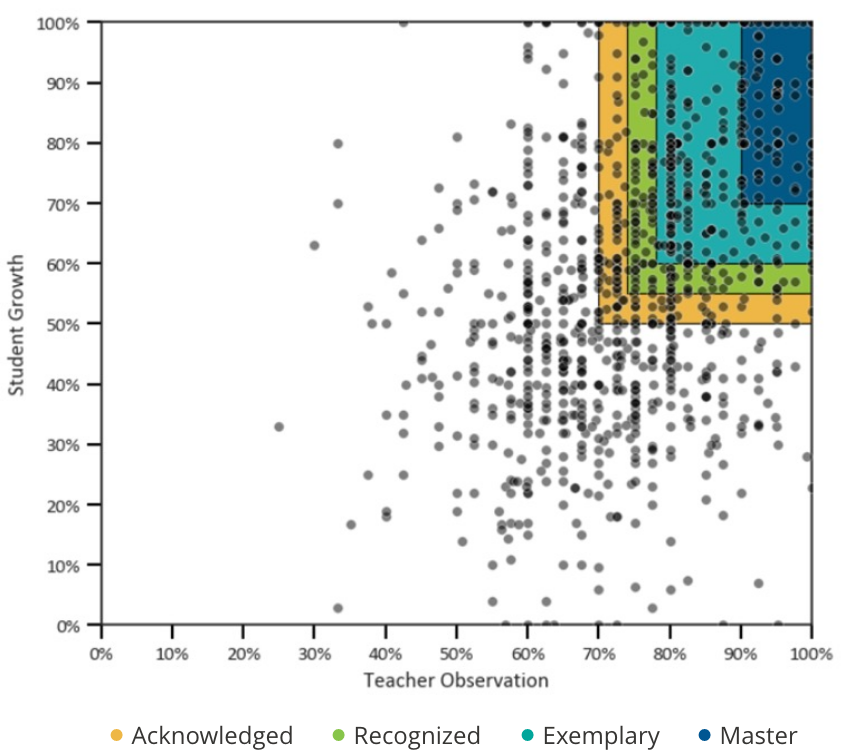 Click to enlarge image Click to enlarge image |
| No Designation: 53% Acknowledged: 12% Recognized: 11% Exemplary: 16% Master: 8% |
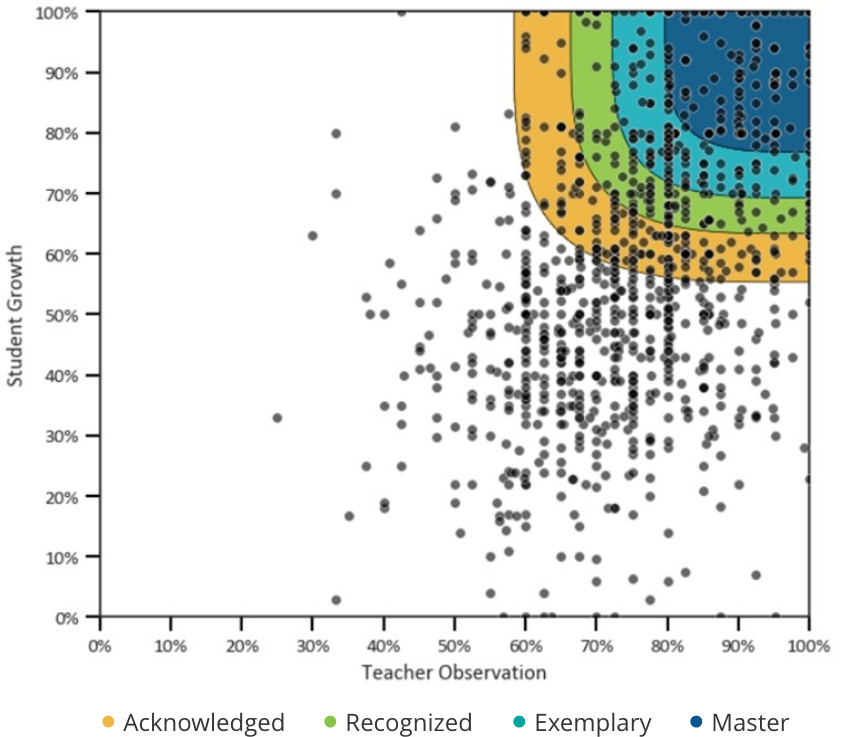
| Compensatory |
|---|
| No minimums |
| Performance flexibility ✓ |
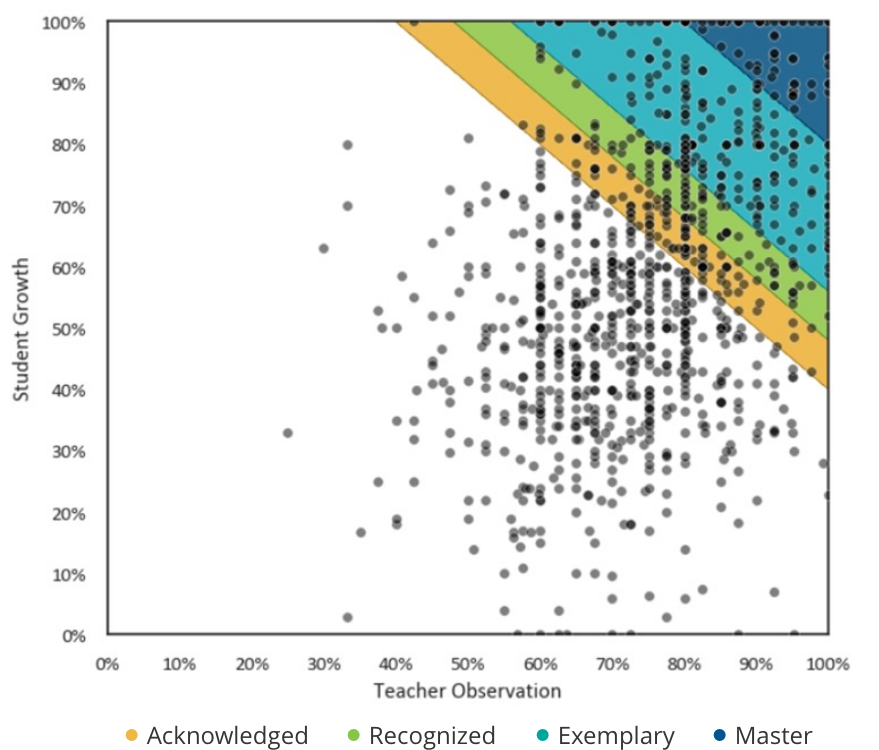 Click to enlarge image Click to enlarge image |
| No Designation:61% Acknowledged: 10% Recognized: 8% Exemplary: 16% Master: 5% |
| Hybrid |
|---|
| Minimums ✓ |
| Performance flexibility ✓ |
 Click to enlarge image Click to enlarge image |
| No Designation: 55% Acknowledged: 16% Recognized: 10% Exemplary: 10% Master: 9% |
Districts that use different weights for categories will need to examine each category separately. However, only one decision making approach should be used for an entire system.
Districts can analyze the data and decide which decision-making approach best fits their system. Questions to consider before making a final decision include:
- Which approach is identifying my most effective teachers?
- Which approach aligns with previous stakeholder engagement?
- Am I using cut point minimums?
- Do my performance standards, weights, or cut points need to be adjusted?
- How do these designations align with implied Texas VAM designations?
- What are the data validation and stakeholder engagement impacts of adjustments to my system?
- Can I justify any changes from what has been previously shared with stakeholders?
- Is this a change I can make now, or do I need this for next year?
It is also important to keep in mind what can and cannot be changed after the data has been collected but before the data has been submitted:
Districts canChange the weighting of approved components. Ex: the system application weighted teacher observation at 30% and student growth at 70%. The LEA can change weighting to 50/50. Remove other optional, non-statutory components. Ex: attendance, student surveys Adjust the standard at which a teacher is able to earn a designation Adjust or establish a minimum requirement to earn a designation |
Districts cannotExclude teacher observation or student growth when determining designations Add or remove eligible teaching assignments Add or remove student growth measures Add or remove teacher observation component |
Once a district selects a decision-making approach and any necessary changes, it will be applied across the system to determine designations.